Optimizing VLF Survey Design and Interpretation
Very Low Frequency (VLF) surveys have been a part of mineral exploration for decades, but the number of new VLF surveys collected has diminished in favour of using time-domain electromagnetic (EM) surveys. Nevertheless, the speed of data acquisition, relative lower cost, and ability to map shallow conductive structures still make them an effective reconnaissance tool for identifying faults, shear zones, graphitic horizons, fractures, and sulphide mineralization. VLF data are almost always acquired alongside ground magnetic surveys, making them a great add-on component to many exploration programs.
In regards to the interpretation of VLF data - it has been largely qualitative. While techniques such as Fraser and Karous-Hjelt filtering are effective for highlighting anomalies, they provide limited information about the geometry of the source. Modern processing methods have changed that. Advances in inversion now allow VLF data to be used to estimate conductor dip, depth, geometry, and relative conductivity, transforming a traditional reconnaissance dataset into a more quantitative interpretation tool.
For companies with extensive historical VLF coverage, this presents an opportunity to extract new geological insights from data that have already been collected.
Survey Design Still Matters
Successful VLF surveys begin long before data collection. Because the method relies on EM fields generated by remote radio transmitters - survey orientation and transmitter selection have a significant influence on the quality of the final dataset.
Similar to magnetic surveys, the ideal survey layout places traverse lines perpendicular to the dominant geological strike. In terms of surveys also collecting VLF data, this survey layout also maximizes coupling with the incoming EM field. Therefore, selecting the appropriate remote transmitter therefore depends not only on signal strength but also on its azimuth relative to the local geological fabric.

The example below illustrates the incoming signal directions from four available transmitters for a project in British Columbia.
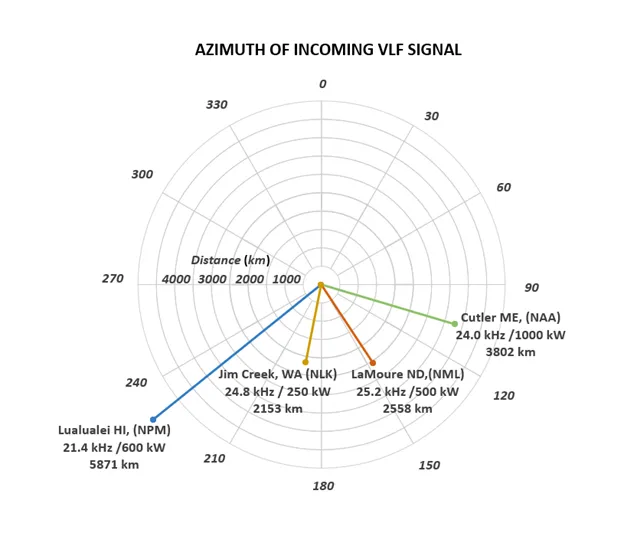
In this example, transmitter azimuths range from approximately 106° to 231°. Selecting the transmitter whose signal is parallel to the dominant geological strike allows survey lines to be oriented perpendicular to both the geology and the incoming electromagnetic field, maximizing the response from conductive structures. Where multiple structural trends exist, more than one transmitter and survey orientation may be used to ensure adequate coverage.
Operational planning is equally important. The remote transmitters undergo scheduled maintenance and occasional unscheduled outages that temporarily interrupt signal transmission. Aurora Geosciences maintains an up-to-date archive of transmitter availability and signal strength, allowing survey planning to minimize downtime and optimize field productivity. When a preferred transmitter is unavailable, crews can often shift to collecting magnetic tie lines or complete other planned survey activities while waiting for signal availability.
Demonstrating Modern VLF Processing
To illustrate what modern inversion can recover, synthetic datasets were generated using a simple model consisting of a 100 Ω·m conductor within a 1000 Ω·m host rock. Because the true subsurface geometry is known, synthetic models provide an objective way to evaluate inversion performance before applying the workflow to field data.
Recovering Conductor Dip
The first example models a conductor dipping 45° to the right.
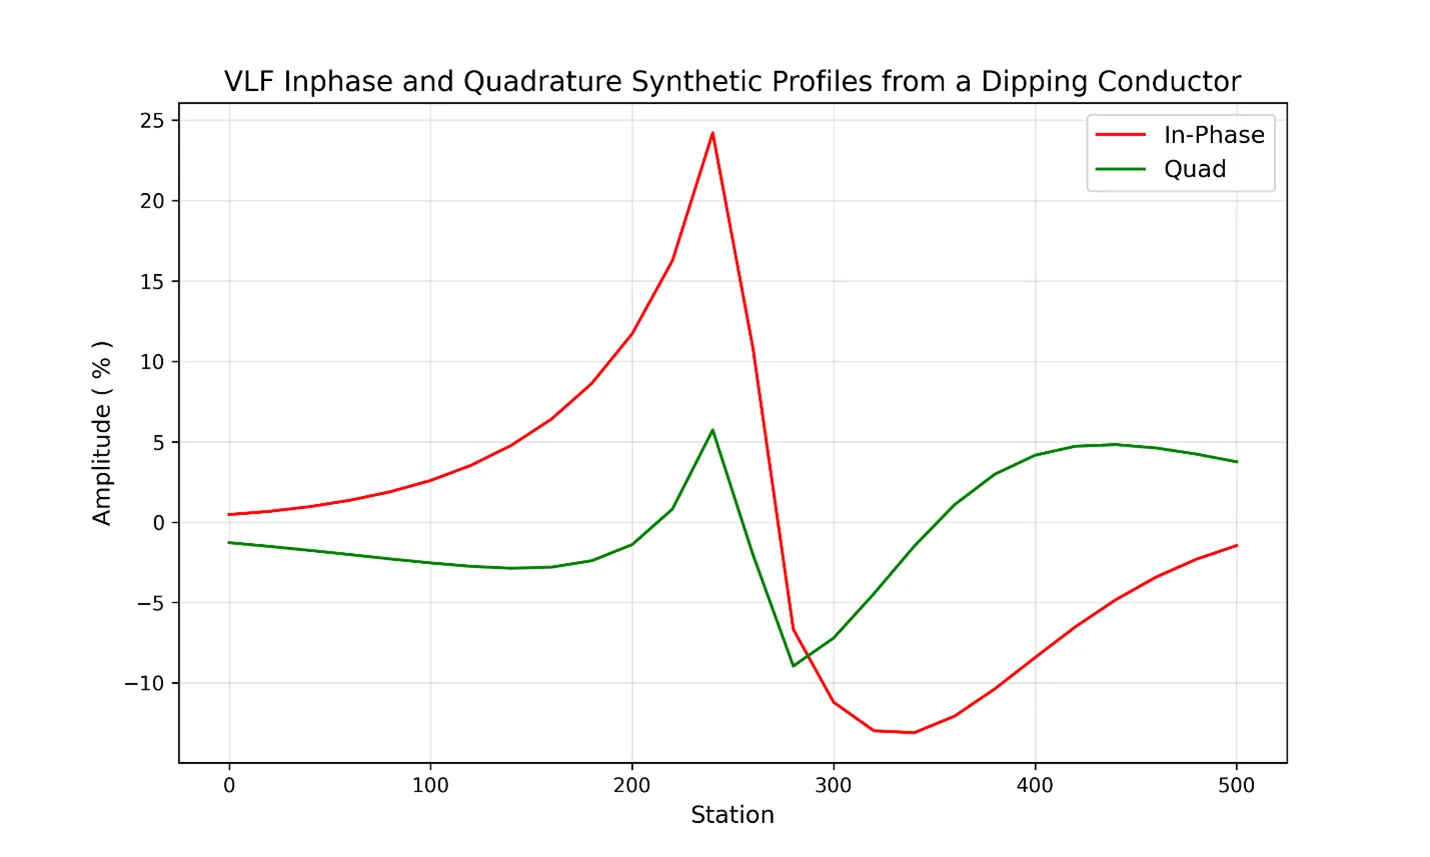
Using two-dimensional inversion, the recovered model accurately reproduces both the dip direction and the geometry of the conductor.
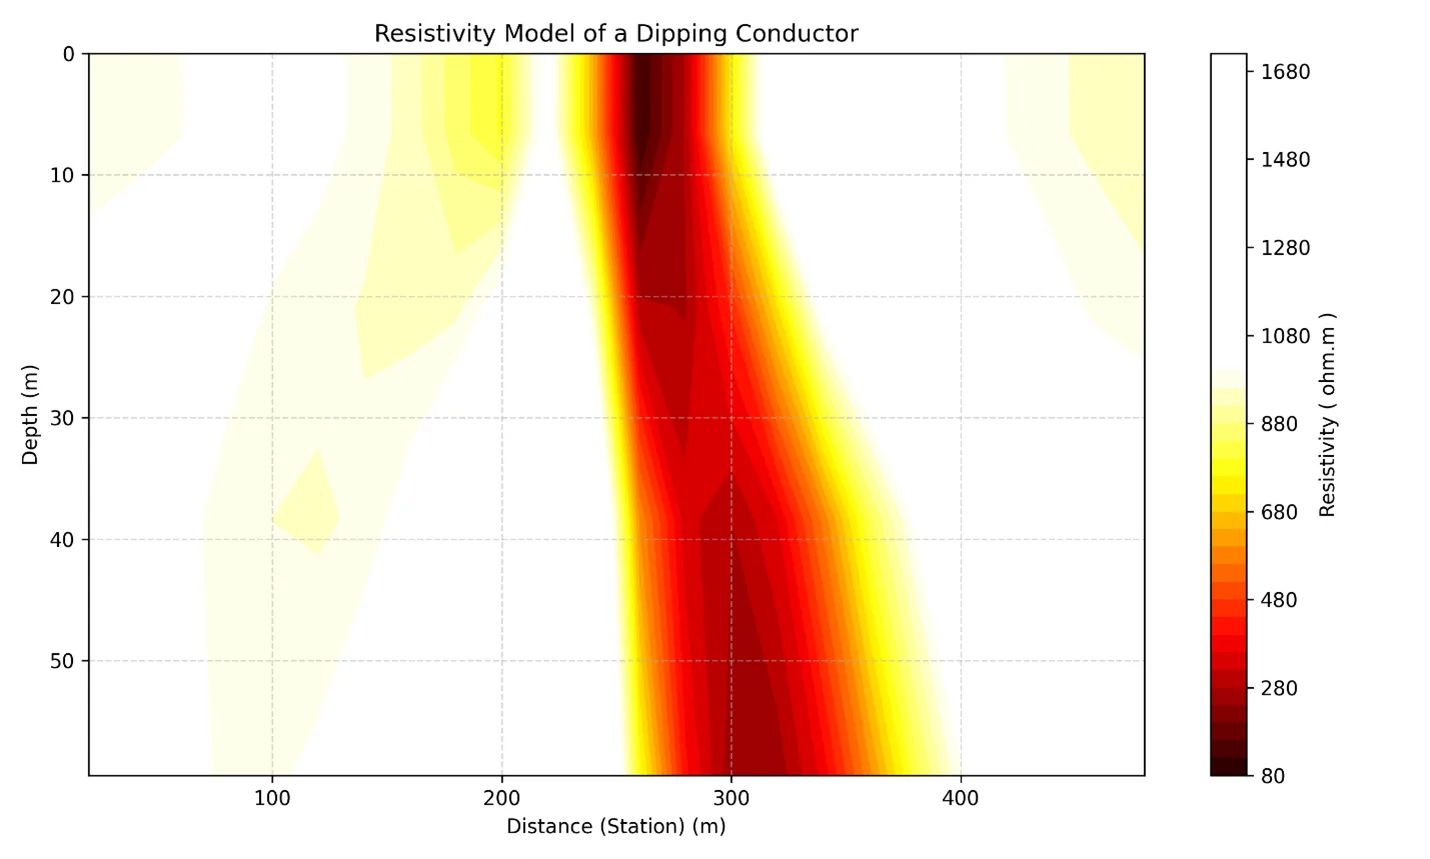
Rather than simply identifying the location of an anomaly, inversion provides geological context that can improve structural interpretation and help prioritize drill targets.
Estimating Conductor Depth
Depth estimation is another important advantage of modern processing.
The examples below compare identical vertical conductors located at depths of 2 metres and 50 metres.
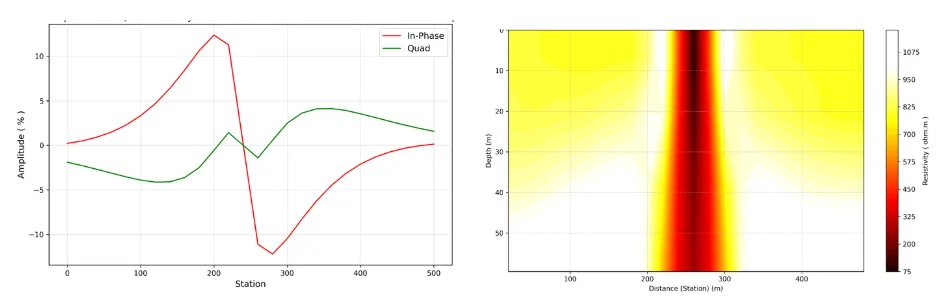
Left: VLF in-Phase and quadrature synthetic profiles from vertical conductor at 2m depth. Right: Resistivity model of a vertical conductor at 2m depth.
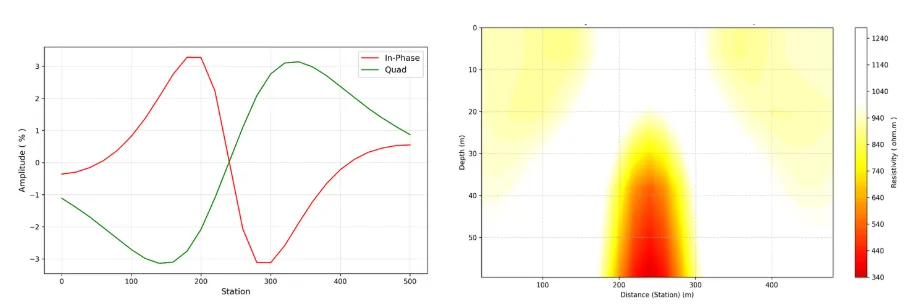
Left: VLF in-Phase and quadrature synthetic profiles from vertical conductor at 50m depth. Right: Resistivity model of a vertical conductor at 50m depth.
Although both conductors produce recognizable VLF responses, inversion successfully distinguishes the differences in depth, demonstrating the method's ability to estimate the position of conductive bodies beneath surface cover.
Extracting More from Existing Data
VLF has traditionally been viewed as a rapid reconnaissance tool used primarily to identify conductive trends. Modern inversion significantly expands that role by providing quantitative estimates of conductor geometry, dip, depth, and relative conductivity while reducing the effects of topography on interpretation.
For exploration programs with large archives of historical VLF data, these advances represent an opportunity to revisit existing datasets with new analytical tools. Rather than collecting additional data, companies may be able to improve geological understanding, refine structural interpretations, and generate new drill targets from information already in hand.
As exploration programs continue to seek greater value from existing datasets, modern VLF processing offers a practical way to transform familiar surveys into more powerful geological interpretation tools.
Related Services
Popular Posts





Categories
Find Us
Yellowknife
3506 McDonald Dr.
Yellowknife, NT
Canada
X1A 2H1
Whitehorse
34A Laberge Rd.
Whitehorse, YT
Canada
Y1A 5Y9
Juneau
Juneau, AK
United States
Message Us
Work
FEATURED CASE STUDIES