Aurora Rapid Reactance Tomography (ARRT) Case Study: Faraday OhmMapper Comparison
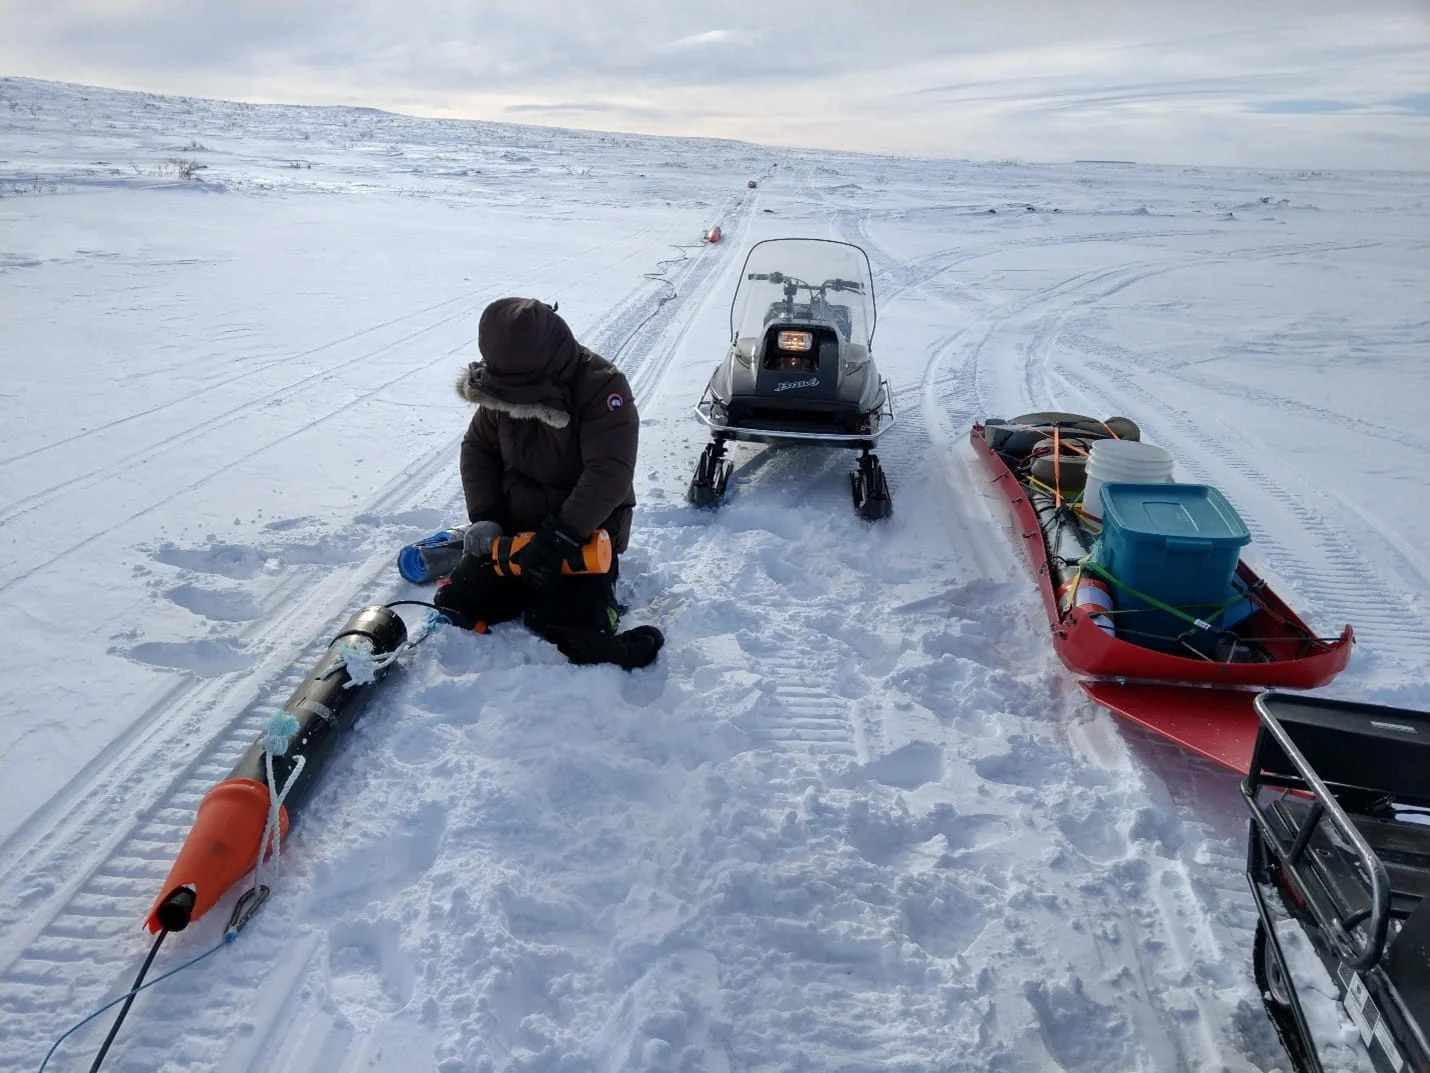
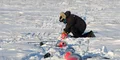
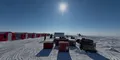
Figure 1: ARRT field set up, Faraday Project, 2018. A technician installs a receiver into its protective housing. Additional receivers in the background. The transmitter is installed in the red toboggan.
Introduction
Aurora Rapid Reactance Tomography (ARRT) is a new method and instrument in ground geophysical exploration produced by Aurora Geosciences Ltd. (AGL), closely related to Geometrics’s OhmMapper (Geometrics, 2009). It is a capacitively coupled electrical dipole instrument capable of transmitting and receiving electrical signals at frequencies from 1 kHz to 20 kHz. The data is analysed to produce geophysical models of electrical resistivity and chargeability.
This document compares the resistivity results between the ARRT and OhmMapper for a survey completed at Kennady North’s Kennady Lake property in the Northwest Territories. There are three kimberlites with NI 43-101 mineral resources discovered on the property. The survey comparison was conducted over the Faraday 1-3 and Faraday 2 kimberlites.
Aurora Rapid Reactance Tomography (ARRT)
Instrument Design
The ARRT instrument is designed from the ground up with arctic exploration in mind. In particular, the instrument components are ruggedized to withstand harsh northern winters and to be towed behind motorized equipment. In this winter setting, production can exceed most other ground methods, limited only to the rate at which the transmitter can safely be towed across uneven terrain.
Survey Design
Independently towed and GPS tracked transmitter and receivers allow for many survey configurations including: traditional 2D dipole-dipole arrays, but also equatorial or other 3D arrays. Any number of receivers can be towed at different separations and geometries to increase the efficiency of data collection. The transmitter can be programmed to transmit any signal within the audio frequency range, although typically this consists of several simultaneous sinusoids.
Data QA/QC and Data Management
Data is recorded on the transmitter and each receiver independently as full waveform audio data. This approach allows for the extraction of useful quality assurance measures such as estimates for the variation of capacitive coupling, signal to noise ratios, and signal ratios (SNR) between different transmitted frequencies (Figure 2). SNR values above 2 are preserved for apparent resistivity data, and SNR values above 10 are preserved for percent frequency effect.
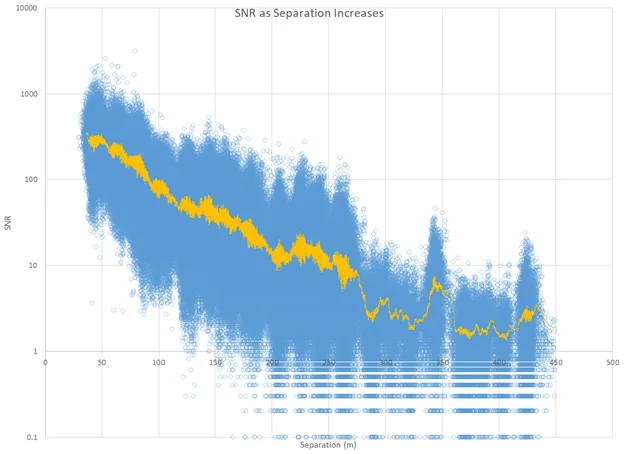
Figure 2: Signal to Noise Ratio at the Faraday project. All recorded data points are plotted as SNR v. transmitter-receiver separation in blue. An average at each separation is plotted in yellow. Using a 40 m receiver dipole increases SNR at large separations.
GPS data is recorded on the transmitter and each receiver, and, when combined with a quality digital elevation model, full 3D position information can be determined for each electrode in the array at any given time, within the accuracy of the GPS units (~4m on transmitter, ~10m on receivers). The geometry and signal amplitudes (transmitted current, received voltage) are combined to produce a value for apparent resistivity, which can be plotted as a 3D pseudosection for quality assurance (Figure 3). The location of the plot point is halfway between the transmitter and receiver GPS locations, and a depth below the surface according to Edwards (1977). Apparent resistivity is calculated using standard methods used in traditional IP and resistivity surveying.
3D electrode position information is translated into a geometric factor (K). Due to the margin of error in the GPS data, the error in K is higher as a percentage for surveys with smaller transmitter-receiver separations, but very small for large separations. This makes the ARRT instrument ideal for mineral exploration and less suitable for very shallow surveys, such as permafrost studies (<10 m).
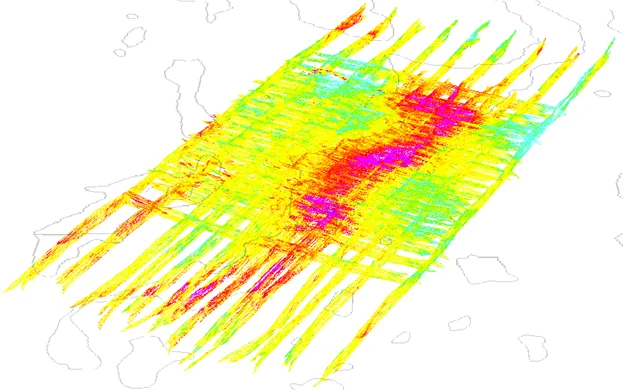
Figure 3: 3D pseudosection of raw data collected at Faraday, 2018, looking north. This data can be spun around in 3D to look for gaps, stripes, regions of interest, in the field on a nightly basis, without requiring an inversion. Conductors are red/pink. Lake outlines in grey for context.
A full description of the physics of capacitively coupled resistivity instruments can be found in Kuras, 2002.
OhmMapper at Faraday
AGL began experimenting with the OhmMapper at the Kelvin kimberlite area, 3 km south of Faraday, in 2012. Due to the OhmMapper’s ability to accurately delineate the geometry of the top of the Kelvin ore body, large scale regional surveys were undertaken along strike of the Kelvin discovery beginning in 2014 and concluding in 2016. This survey area became the Kelvin-Faraday Corridor, and in combination with other methods, the OhmMapper survey was able to delineate the geometry of a number of kimberlites under Faraday Lake. These anomalies were drilled and confirmed to be significant diamondiferous kimberlites with a similar orientation to the Kelvin kimberlite. More details on this property and the kimberlites therein can be found in AGL, 2019.
The OhmMapper survey was conducted with the following parameters: 20 m transmitter and receiver dipoles, n=6,6.5,7,7.5,8 on the first pass; n=9,9.5,10,10.5,11 on the second pass. The data was manually inspected for quality and inverted in 2D using Geotomo Software’s Res2DInv, and industry standard for resistivity inversions. These 2D models were then gridded to create a 3D voxel. These voxels were sliced to create plan maps at various depths, to a maximum of 60 m below ground surface. In these models, the tops of kimberlite were successfully identified.
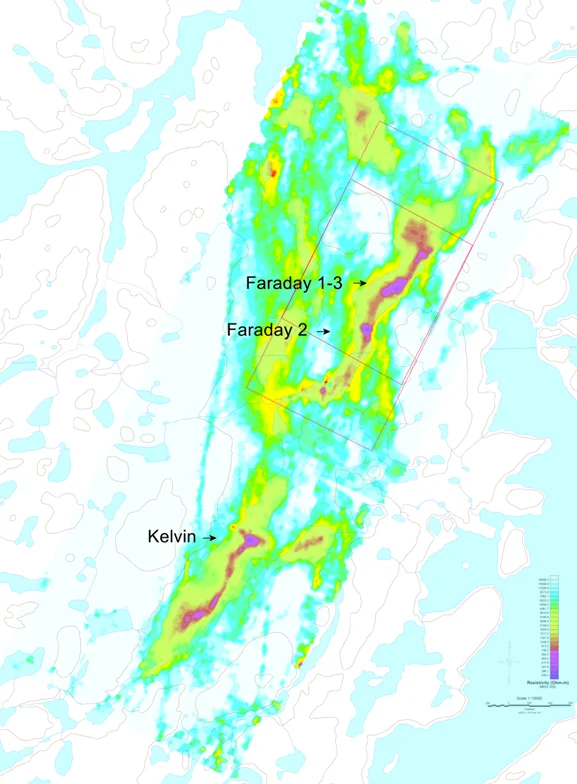
Figure 4: Kimberlite detected by OhmMapper in the Kelvin-Faraday Corridor. 380 m above sea level depth slice through the voxel created from 2D OhmMapper inversions. Comparison area marked in pink. Inner red area has equivalent data density, for fairest comparison.
ARRT at Faraday
Figure 4 shows the bounding box of the comparison area between the ARRT and the OhmMapper at Faraday. The outer (pink) box shows the total area studied in 2019. The inner (red) box shows the area where the data density is identical between the two surveys. Lines were designed to have the same locations and orientations. The survey was completed in 6 days, with an approximate survey productivity of 60 km driven per day.
The transmitter and receiver operated with 20 m dipoles, except where specified otherwise. N-spacings are approximate, due to the transmitter and receiver operators towing independently. Four receivers were used on the first three passes with nominal: n=2,3,4,5; n=6,7,8,9; n=10,11,12,13. The fourth and fifth pass used two 20 m receiver dipoles and a 40 m dipole (marked with *) for nominal: n=14,15,16.5*; n=18,19,20.5*. Data was inspected in the field for errors using the 3D pseudosection shown in Figure 3. The effect of the 40 m dipole on signal to noise ratio is seen in Figure 2.
3D Inversions Comparison
Because site infrastructure was subsequently added in the area of the Kelvin kimberlite, the Faraday kimberlites were chosen to test the new approaches developed with the ARRT instrument, and compare those results between the OhmMapper and ARRT.
As the ARRT is an inherently 3D instrument, 2D inversions are not reasonable without substantial additional work. In order to complete an accurate comparison with the OhmMapper, a 3D inversion of the OhmMapper data collected at the Faraday property was performed. AGL wrote new processing software for the OhmMapper which replaces the software provided by Geometrics in order to facilitate these inversions. These datasets are inverted using Geotomo Software’s new enterprise edition 3D inversion software (Loke et al., 2020).
The following are 3D inversions results for the ARRT instrument, trimmed to a resistivity isosurface appropriate for identification of the ore bodies -- ARRT (purple) and OhmMapper (blue). The Faraday ore bodies, as modelled by drilling results are also included (grey).
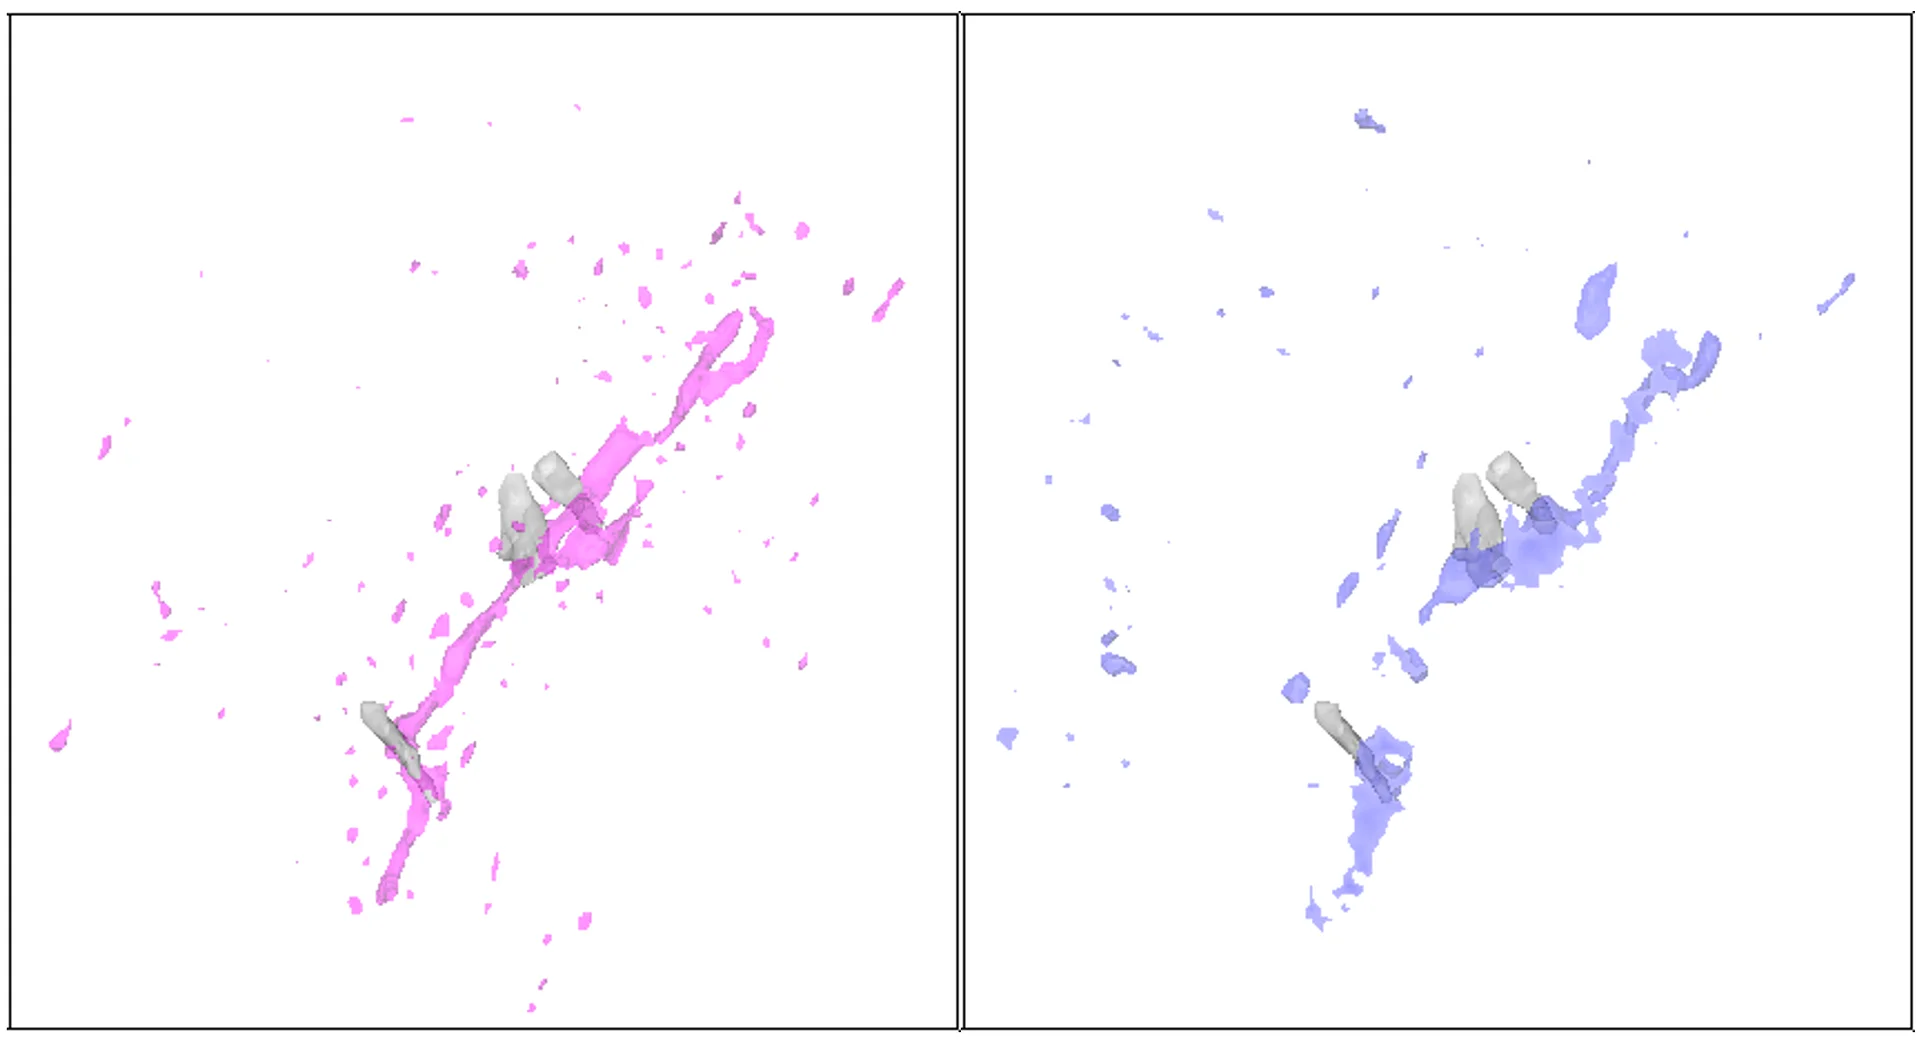
Figure 5: Plan view of comparison area showing resistivity isosurface of ARRT (left, purple) and OhmMapper (right, blue). Drill delineated kimberlite ore bodies in grey.
The linear features running between the ore bodies in the ARRT data have not been tested by drilling yet, but they are proposed to be a thin kimberlite dike. Faraday 2, the southernmost of the ore bodies, is picked up by both surveys, however the ARRT response more accurately shows the location of the ore body. This is illustrated in this cutaway view, looking northeast. Total depth of the model is 100 m below ground surface.
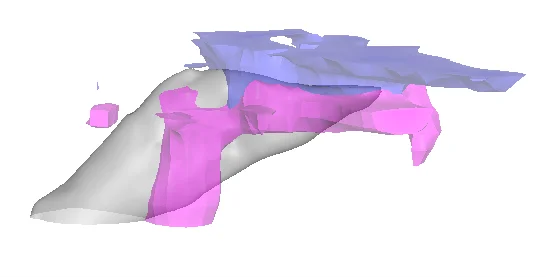
Figure 6: 3D models from OhmMapper (blue), ARRT (purple), and drill delineated kimberlite ore body at Faraday 2, from lake surface to 100 m below lake surface.
Since the two devices are using the same physics, the major difference in the models at depth is due to the increased transmitter power of the ARRT device. The OhmMapper, while correctly indicating the presence of an anomaly, does not well define the shape of the anomaly. Drilling the plunging ARRT anomaly here would have intersected kimberlite.
Productivity Comparison
Instrument Design
The OhmMapper instrument was never designed to be towed behind a snowmobile on the tundra, in arctic conditions. Through experience, AGL has made improvements to the OhmMapper hardware in an attempt to field ruggedize the equipment, and improve productivity. However, even with all of these improvements, the OhmMapper tends to require a great deal of care and maintenance to operate, reducing the theoretical upper limits of productivity substantially. In theory, you can tow the OhmMapper at 10 km/h all day. In practice, a typical day with favourable terrain (such as the case with Faraday) will result in about 20 total km driven.
The ARRT instrument, while newer and more experimental (and with all the caveats associated with it), was designed for arctic exploration. These design choices result in a productivity that is much higher for the ARRT. Again, the theoretical maximum survey speed is approximately 10 km/h. In practice, this will result in about 60 total km driven per day.
This assumes that the survey design accounts for the different capacities of the instruments.
Survey Design
The OhmMapper, typically employed as a 2D survey instrument, surveys in ‘depth first’ mode, meaning the instrument does multiple passes with different transmitter receiver separations on the same line before moving on to the next line. This allows for nightly cross sections to be plotted on each line for quality assurance. However, there is a performance penalty to changing the separations multiple times on each line.
Whereas, due to the 3D nature of the ARRT instrument, the benefit of 2D nightly cross sections is absent. Taking advantage of this difference, the ARRT can survey in ‘breadth first’ mode, meaning a single separation is used across the entire survey grid first, facilitating rapid turnaround between lines. Then, once a grid is completed with a given separation, some rope is let out and the entire grid is driven again – the same lines, in the same orientation, with nearly the same productivity. The breadth first approach guarantees complete coverage of the grid early, and quality assurance is done in 3D pseudosections.
Design Flexibility
The second advantage of the breadth first approach is that you can change your dipole size on the receivers easily. Reconfiguring the OhmMapper receivers for larger dipoles stops productivity if performed on each line for 20-60 minutes. The productivity hit precludes this option in a depth first survey. Whereas, one can swap the ARRT receiver dipole cables for longer cables once when starting another pass of the grid, and the impact on the survey is negligible. This allows the ARRT to survey deeper targets while maintaining similar productivity to shallow targets. At the end of each pass, the data can be evaluated in the field for signal to noise ratio, and the dipole size for the subsequent pass can be evaluated.
During the Faraday field test for the ARRT, a choice to use two 20 m dipole receivers and a 40 m dipole receiver in the same array was made for the final two passes. This choice was made as a trade-off between improved resolution of the 20 m dipoles (if adequate SNR existed), versus reduced resolution in the 40 m dipoles, but increased SNR (and therefore data reliability). This combination of multiple dipole sizes is possible with the ARRT due to independent receivers, but cannot be performed with the OhmMapper with a single pass.
Increased Depth
The OhmMapper uses a carrier signal to transmit the transmitter power level wirelessly to the receiver. This carrier signal is the source of a great many problems when operating in conductive ground. At wide separations, this prevents the OhmMapper from functioning well or at all – the operators need to constantly stop moving while the receivers lock back on to the transmitter power levels. The OhmMapper transmitter is limited to a maximum power of 16 W.
As the ARRT has independent on board data logging on all devices, and higher transmitter power, it does not suffer from this problem. If the signal strength is too weak on a receiver, it will be rejected due to low signal to noise ratio, but will not cause the survey to halt. The ARRT transmitter also operates at higher power, typically 80 W.
Power dispersion for dipole-dipole surveys drops as distance cubed. To double the transmitter-receiver separation, the power level needs to be a factor of eight higher. The combined effect of higher power and no carrier wave related troubleshooting allows the ARRT to operate at increased separations, and thus increased depth. Furthermore, increasing the receiver dipole size allows additional improvements at large separations.
Limitations
Failure chains: The OhmMapper device uses a single data logger, at the front of the chain. The transmitter (wirelessly), and then each receiver, forwards their data up the chain until it finally hits the data logger. This results in multiple points of failure. If a single receiver is not working, the whole system is not working, and the operator needs to stop to troubleshoot. The likelihood of a failure occurring and stopping the entire system increases with the number of receivers used. The OhmMapper survey at Faraday used a five receiver system for most of the data collection, however AGL has since reduced the number of receivers used during an OhmMapper survey to decrease the system failure rate, at the cost of requiring more passes on a single line to collect the same amount of data.
The ARRT provides no user feedback from the receivers during surveying, and no knowledge of whether a receiver has failed. Due to multiple receivers being used at once, and independent data logging, a failed receiver is not noticed, and is not attended to during the survey. In practice, the receivers have been tested to be 95% reliable. If the receiver operator is towing multiple receivers, there is usually significant data redundancy in the other receivers. This fault tolerant design improves productivity versus the OhmMapper.
Conclusion
At the Faraday test location, the ARRT survey was approximately three times faster than the OhmMapper survey. Much of this difference is due to instrument reliability in arctic field conditions. Some of this difference is due to choosing breadth first survey design. The ARRT productivity drastically exceeds that of the OhmMapper at large separations due to the OhmMapper transmitter level signal being unreliable at great distances.
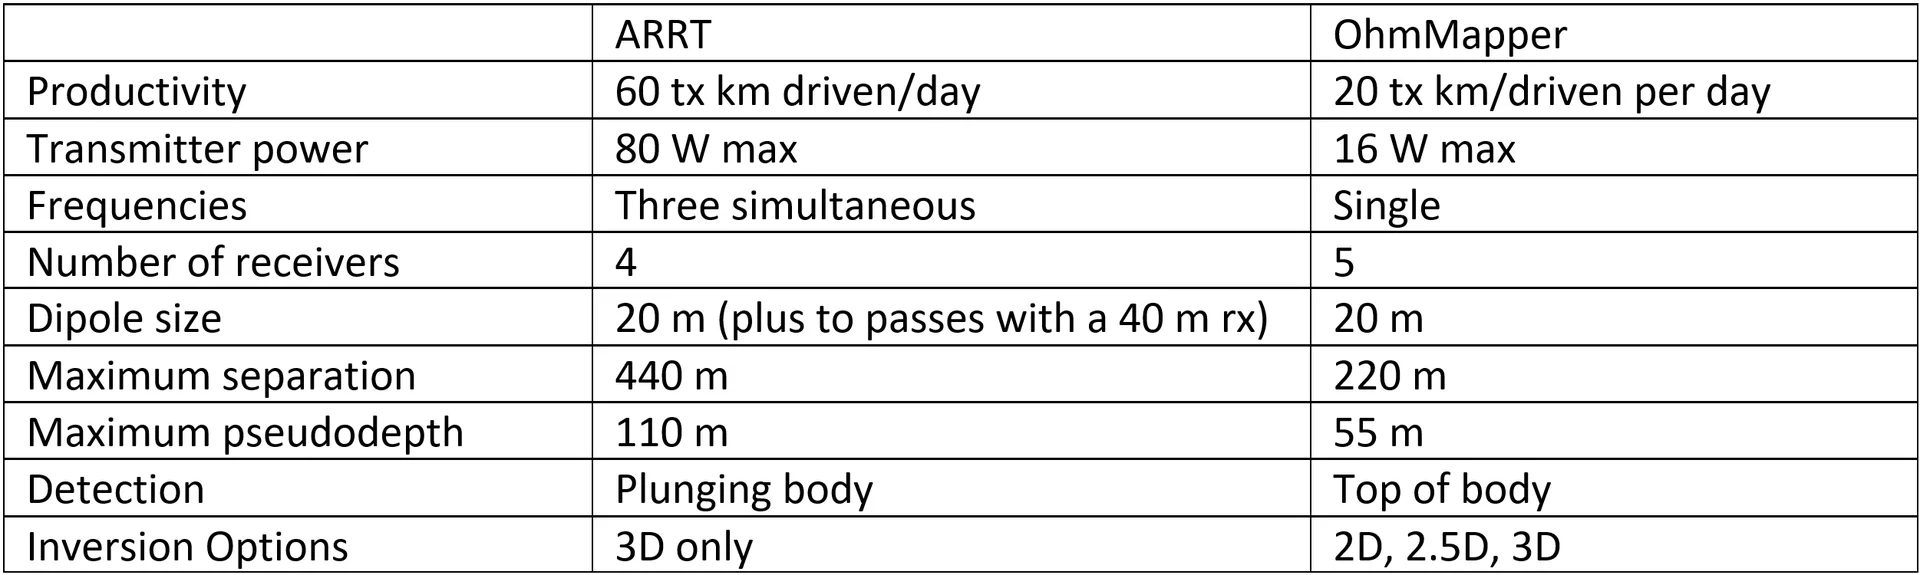
The following table provides a brief overview of the differences between the ARRT and OhmMapper results at Faraday. Values provided are based on real values achieved in this comparison.
References
Aurora Geosciences Ltd. (AGL), 2019. Project Exploration and Faraday Inferred Mineral Resource Estimate Update, Kennady North Project, Northwest Territories, Canada. NI43-101 2019 Technical Report.
Edwards, L.S., 1977. A Modified Pseudosection for Resistivity and IP. Geophysics, Vol 42, No 5 (August 1977), pp 1020-1036.
Geometrics, 2009. Resistivity Surveying, OhmMapper, Capacitively Coupled Resistivity System (CCR). Presentation, May 2009. geometrics.com
Kuras, O. 2002. The Capacitive Resistivity Technique for Electrical Imaging of the Shallow Subsurface. 308pp. University of Nottingham.
Loke, M.H., Rucker, D., Dahlin, T. and Chambers, J.E., 2019. Recent advances in the geoelectrical method and new challenges: A software perspective. FastTimes, 24 (4), 56-62.
Popular Posts


Categories
Find Us
Yellowknife
3506 McDonald Dr.
Yellowknife, NT
Canada
X1A 2H1
Whitehorse
34A Laberge Rd.
Whitehorse, YT
Canada
Y1A 5Y9
Juneau
Juneau, AK
United States
Message Us
Work
FEATURED CASE STUDIES
-
Aurora Rapid Reactance Tomography (ARRT) - Rapid Electrical Imaging for Mineral Exploration
Jun 22, 2026
-
Operational Trust in the Field - A Case Study at White Cliff Minerals’ Rae Copper Project
Jun 22, 2026
-
GIS - Based Mineral Potential Regional-Scale Study - Slave Geological Province, NWT
Apr 09, 2026